
Intelligent Investing
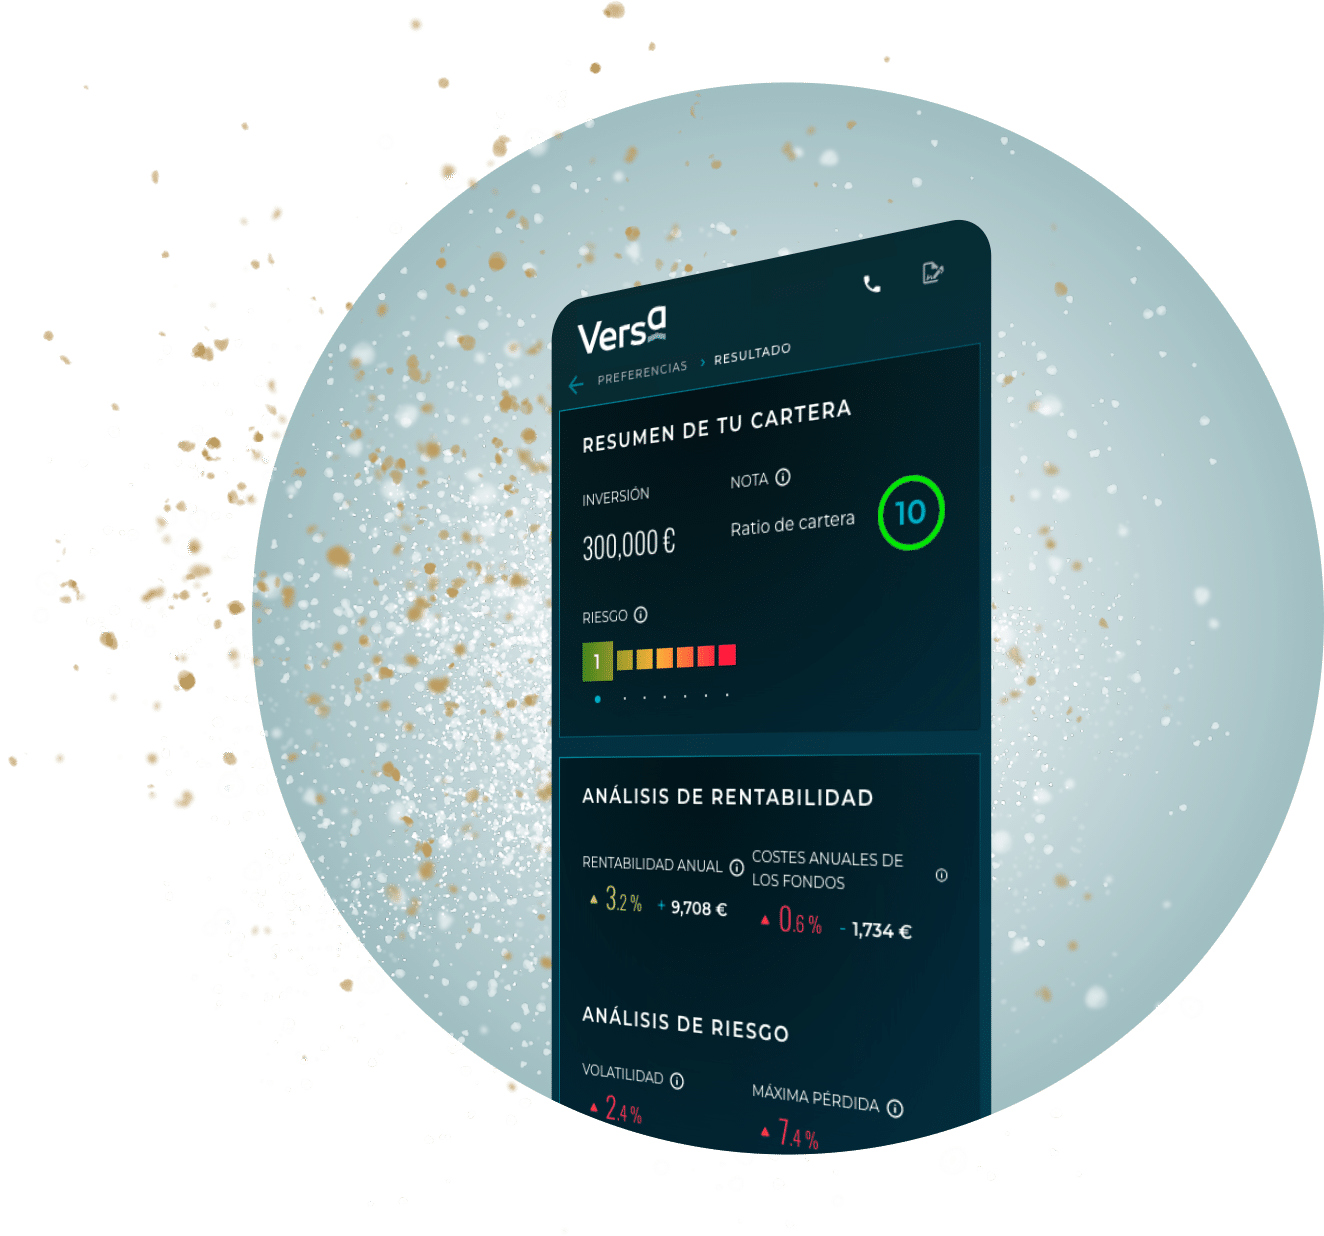
The first ever portfolio management service in which customers can analyse, compare and configure new portfolios through the fusion of the most advanced technology and the experience of our asset managers.
DISCOVER MORE
Diversify your Investment Fund portfolio – Come to VERSA and we will explain why

Strength
Part of the Miraltabank group, founded in 2011.
A securities company regulated and supervised by the CNMV.

Daily reviews
Portfolio aligned daily and not monthly, even to include or exclude funds and change risk profiles.

Diversification
Your funds are uncorrelated, which means a more diversified and complete portfolio.

Open architecture
Possibility to access any fund from any international fund manager. We have a universe of 50,000 funds.

Clean Classes
Skip the intermediaries with us and save on third-party management commissions.

Independent character
We invest capital through our expertise and technology. We do not depend on third-party analysis or banks.

No obligation to stay
You can move in and out of your mutual fund portfolio whenever you want and without restrictions.

After-sales service
An unparalleled customer service that will answer all your questions and offer you the best investment opportunities.
Strength and flexibility for growth
Versa is the new way of understanding portfolio management. Versa brings together the latest technology, a selection of some of the best funds and a dedicated team of asset managers to help you invest better.
VERSA TEMPLATE PORTFOLIOS
View general information about VERSA – See the FAQs
Our technology gives you two options
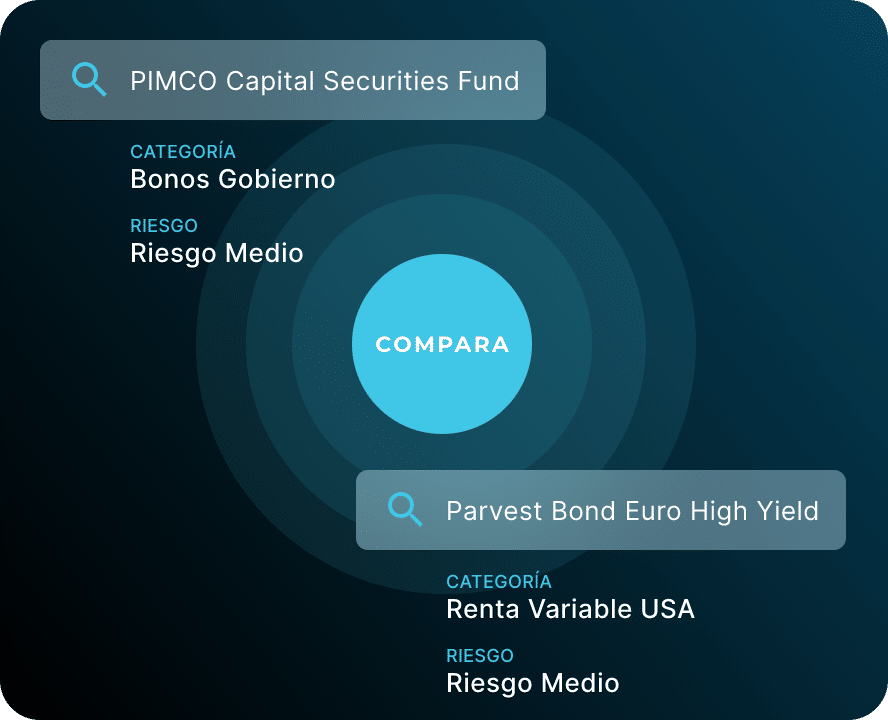
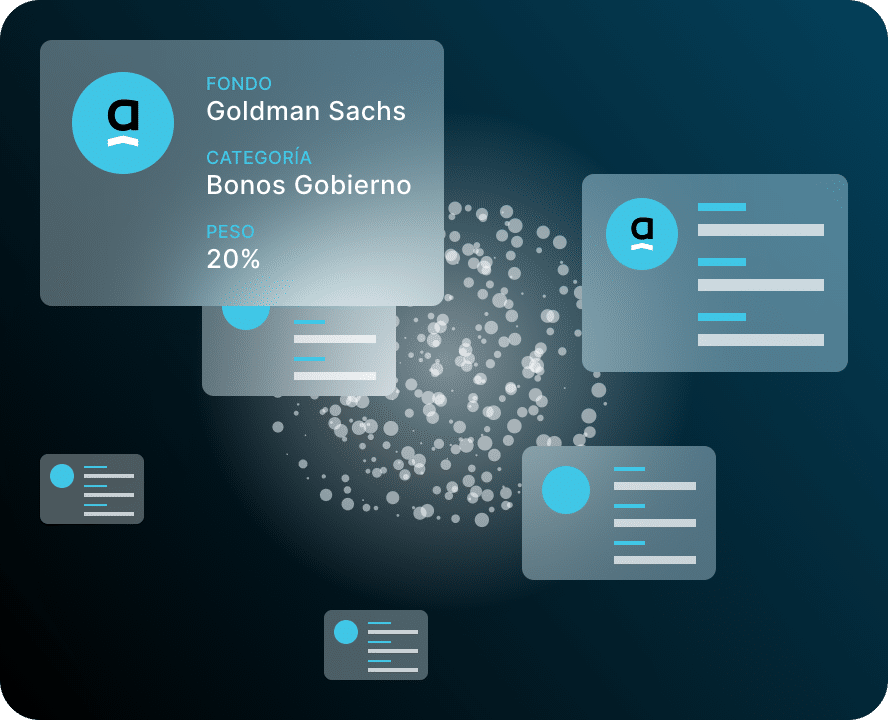
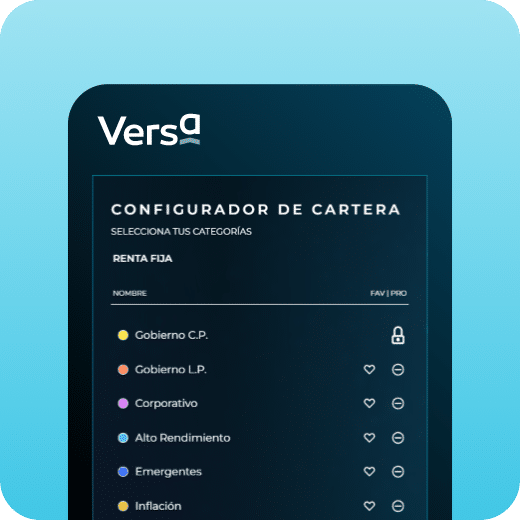
In VERSA, you can either reconsider your current fund portfolio or create one from scratch and simulate your returns by adjusting diversification and risk.
Reconsider your current portfolio
Investment Diagnostics
Build your portfolio
Portfolio configurator
TYPES OF PORTFOLIOS ↓
VERSA Nº2 ↓
The Miraltabank Conservative portfolio suits investors who want slightly outperforming bonds with low equity exposure.
ACCUMULATED YIELD

PORTFOLIO DETAILS
- Launched on
- Currency
- Time horizon
- Currency
- Asset classes
- Benchmark index
- Management fee
- Deposit fee
- 31/12/2017
- Euro
- 2-4 años
- Euro
- Fondos de Inversión UCIT
- 25% EONIA + 60% RF + 15% RV
- 0,75%
- 0%
PERFORMANCE DATA
- Mes
- 2023
- 12 months
- 3 years (annualised)
- 5 years (annualised)
- 2022
- 2021
- 2020
- 2019
- 2018
- 1.38 %
- 1.96 %
- 7.69 %
- 1.2 %
- 2.06 %
- -7,58%
- 2,52%
- 3,15%
- 5,81%
- -3,69%
VERSA Nº3 ↓
Portfolio for investors who want returns linked to fixed income without giving up the diversification potential of equities or other assets.
ACCUMULATED YIELD

PORTFOLIO DETAILS
- Launched on
- Currency
- Time horizon recomendado
- Asset classes
- Benchmark index
- Management fee
- Deposit fee
- 31/12/2017
- Euro
- 2-4 años
- Fondos de Inversión UCIT
- 20% EONIA + 50% RF + 30% RV
- 0,75%
- 0%
PERFORMANCE DATA
- Mes
- 2023
- 12 months
- 3 years (annualised)
- 5 years (annualised)
- 2022
- 2021
- 2020
- 2019
- 2018
- 2.02 %
- 3.26 %
- 9.44 %
- 1.93 %
- 3.19 %
- -9,05%
- 4,79%
- 4,02%
- 9,55%
- -4,70%
VERSA Nº4 ↓
Portfolio for investors seeking diversified equity and bond exposure
ACCUMULATED YIELD

PORTFOLIO DETAILS
- Launched on
- Currency
- Time horizon recomendado
- Asset classes
- Benchmark index
- Management fee
- Deposit fee
- 31/12/2017
- Euro
- 3-4 años
- Fondos de Inversión UCIT
- 10% EONIA + 45% RF + 45% RV
- 0,75%
- 0%
PERFORMANCE DATA
- Mes
- 2023
- 12 months
- 3 years (annualised)
- 5 years (annualised)
- 2022
- 2021
- 2020
- 2019
- 2018
- 2.58 %
- 4.23 %
- 10.59 %
- 2.41 %
- 4.28 %
- -11,25%
- 8,48%
- 4,96%
- 13,22%
- -8,43%
VERSA Nº5 ↓
Suitable portfolio for those investors who want exposure to equities, but without forgetting the diversification offered by fixed income.
ACCUMULATED YIELD

PORTFOLIO DETAILS
- Launched on
- Currency
- Time horizon recomendado
- Asset classes
- Benchmark index
- Management fee
- Deposit fee
- 31/12/2017
- Euro
- +5 años
- Fondos de Inversión UCIT
- 5% EONIA + 35% RF + 60% RV
- 0,75%
- 0%
PERFORMANCE DATA
- Mes
- 2023
- 12 months
- 3 years (annualised)
- 5 years (annualised)
- 2022
- 2021
- 2020
- 2019
- 2018
- 2.95 %
- 5.54 %
- 13.07 %
- 1.97 %
- 4.02 %
- -15,60%
- 9,76%
- 4,96%
- 13,22%
- -8,43%
VERSA Nº6 ↓
Portfolio for investors seeking a majority equity exposure with a high-risk tolerance
ACCUMULATED YIELD

PORTFOLIO DETAILS
- Launched on
- Currency
- Time horizon recomendado
- Asset classes
- Benchmark index
- Management fee
- Deposit fee
- 31/12/2017
- Euro
- +5 años
- Fondos de Inversión UCIT
- 5% EONIA + 20% RF + 75% RV
- 0,95%
- 0%
PERFORMANCE DATA
- Mes
- 2023
- 12 months
- 3 years (annualised)
- 5 years (annualised)
- 2022
- 2021
- 2020
- 2019
- 2018
- 3.67 %
- 7.12 %
- 16.05 %
- 3.17 %
- 5.93 %
- -16,60%
- 12,72%
- 5,50%
- 21,65%
- -10,51%
VERSA Nº7 ↓
Portfolio for investors seeking a majority equity exposure with a high-risk tolerance.
ACCUMULATED YIELD

PORTFOLIO DETAILS
- Launched on
- Currency
- Time horizon recomendado
- Asset classes
- Benchmark index
- Management fee
- Deposit fee
- 31/12/2017
- Euro
- +5 años
- Fondos de Inversión UCIT
- 5% EONIA + 5% RF + 90% RV
- 0,95%
- 0%
PERFORMANCE DATA
- Mes
- 2023
- 12 months
- 3 years (annualised)
- 5 years (annualised)
- 2022
- 2021
- 2020
- 2019
- 2018
- 4.1 %
- 8.63 %
- 18.54 %
- 3.4 %
- 6.07 %
- -18,82%
- 14,03%
- 5,50%
- 21,65%
- -10,51%
The profitability expressed refers to simulated historical results for the period from 12/29/14 to 12/31/17. The vertical line drawn on the charts marks the beginning of the portfolio management service. The results between 01/01/18 and 09/30/2022 correspond to the conservative portfolio and reference index (25% EONIA +60% RF + 15% RV) of the contract in force in said period
Data as of closing date of 12/31/2023. Source: Miraltabank. The profitability expressed is gross, with commissions and other applicable expenses being 0.75%. Past performance is not indicative or a guarantee of future returns.
The performance expressed refers to simulated historical results for the period from 12/29/14 to 12/31/17. The vertical line drawn on the graphs marks the beginning of the portfolio management service. The results between 01/01/18 and 05/31/2022 correspond to the conservative portfolio and benchmark index (25% EONIA +60% RF + 15% RV) of the contract in force during this period.
Data as of 29/02/2024. Source: Miraltabank. The yield expressed is gross, with commissions and other applicable expenses of 0.75%. Past performance is not a reliable indicator of future results.
The performance expressed refers to simulated historical results for the period from 12/29/14 to 12/31/17. The vertical line drawn on the graphs marks the beginning of the portfolio management service. The results between 01/01/18 and 31/05/22 correspond to the conservative portfolio and benchmark index (20% EONIA + 50% RF + 30% RV) of the contract in force during that period.
Data as of 29/02/2024. Source: Miraltabank. The return expressed is gross, with commissions and other applicable expenses of 0.75%. Past performance is not a reliable indicator of future results..
The performance expressed refers to simulated historical results for the period from 12/29/14 to 12/31/17. The vertical line drawn on the graphs marks the beginning of the portfolio management service. The results between 01/01/18 and 05/31/2022 correspond to the conservative portfolio and benchmark (10% EONIA + 45% RF + 45% RV) of the contract in force during this period..
Data as of 29/02/2024. Source: Miraltabank. The yield expressed is gross, with commissions and other applicable expenses of 0.75%. Past performance is not a reliable indicator of future results.
The performance expressed refers to simulated historical results for the period from 12/29/14 to 12/31/17. The vertical line drawn on the graphs marks the beginning of the portfolio management service. The results between 01/01/18 and 05/31/22 correspond to the conservative portfolio and benchmark index (5% EONIA + 35% RF + 60% RV) of the contract in force during that period.
Data as of 29/04/2024. Source: Miraltabank. The yield expressed is gross, with commissions and other applicable expenses of 0.75%. Past performance is not a reliable indicator of future results.
The performance expressed refers to simulated historical results for the period from 12/29/14 to 12/31/17. The vertical line drawn on the graphs marks the beginning of the portfolio management service. The results between 01/01/18 and 31/05/22 correspond to the conservative portfolio and benchmark index (5% EONIA + 20% RF + 75% RV) of the contract in force during that period..
Data as of 29/02/2024. Source: Miraltabank. The return expressed is gross, with commissions and other applicable expenses of 0.95%. Past performance is not a reliable indicator of future results.
The performance expressed refers to simulated historical results for the period from 12/29/14 to 12/31/17. The vertical line drawn on the graphs marks the beginning of the portfolio management service. The results between 01/01/18 and 05/31/22 correspond to the conservative portfolio and benchmark index (5% EONIA + 5% RF + 90% RV) of the contract in force during that period.
Data as of 29/02/2024. Source: Miraltabank. The return expressed is gross, with commissions and other applicable expenses of 0.95%. Past performance is not a reliable indicator of future results.
PROFILE Nº2 ↓
The Miraltabank Conservative portfolio suits investors who want slightly outperforming bonds with low equity exposure.
CUMULATIVE RETURN

PORTFOLIO DETAILS
- Launched on
- Currency
- Time horizon
- Asset classes
- Benchmark index
- Management fee
- Deposit fee
- 31/12/2017
- Euro
- 2-4 años
- Fondos de Inversión UCIT
- 25% EONIA + 60% RF + 15% RV
- 0,75%
- 0%
PERFORMANCE DATA
- Month
- 2023
- 12 months
- 3 years (annualised)
- 5 years (annualised)
- 2022
- 2021
- 2020
- 2019
- 2018
- 1.38 %
- 1.96 %
- 7.69 %
- 1.2 %
- 2.06 %
- -7,58%
- 2,52%
- 3,15%
- 5,81%
- -3,69%
DOCUMENTATION
- Presentación Narval FI
- Folleto completo
- Folleto clase A
- lorem lorem lorem ipsu
- lore sir amet dolorew
- Datos fundamentales para el inversor clase G
- Cuentas anuales 2019
- Informe semestral 1S 2020
- lorem ipsum doloer 3
- lorem ipsum doloer
PROFILE Nº3 ↓
Portfolio for investors who want returns linked to fixed income without giving up the diversification potential of equities or other assets.
CUMULATIVE RETURN

PORTFOLIO DETAILS
- Launched on
- Currency
- Time horizon
- Asset classes
- Benchmark index
- Management fee
- Deposit fee
- 31/12/2017
- Euro
- 2-4 años
- Fondos de Inversión UCIT
- 20% EONIA + 50% RF + 30% RV
- 0,75%
- 0%
PERFORMANCE DATA
- Month
- 2023
- 12 months
- 3 years (annualised)
- 5 years (annualised)
- 2022
- 2021
- 2020
- 2019
- 2018
- 2.02 %
- 3.26 %
- 9.44 %
- 1.93 %
- 3.19 %
- -9,05%
- 4,79
- 4,02%
- 9,55%
- -4,70%
DOCUMENTATION
- Presentación Narval FI
- Folleto completo
- Folleto clase A
- lorem lorem lorem ipsu
- lore sir amet dolorew
- Datos fundamentales para el inversor clase G
- Cuentas anuales 2019
- Informe semestral 1S 2020
- lorem ipsum doloer 3
- lorem ipsum doloer
Portfolio for investors seeking diversified equity and bond exposure
CUMULATIVE RETURN

PORTFOLIO DETAILS
- Launched on
- Currency
- Time horizon
- Asset classes
- Benchmark index
- Management fee
- Deposit fee
- 31/12/2017
- Euro
- 3-4 años
- Fondos de Inversión UCIT
- 10% EONIA + 45% RF + 45% RV
- 0,75%
- 0%
PERFORMANCE DATA
- Month
- 2023
- 12 months
- 3 years (annualised)
- 5 years (annualised)
- 2022
- 2021
- 2020
- 2019
- 2018
- 2.58 %
- 4.23 %
- 10.59 %
- 2.41 %
- 4.28 %
- -11,25%
- 8,48%
- 4,963%
- 13,22%
- -8,43%
DOCUMENTATION
- Presentación Narval FI
- Folleto completo
- Folleto clase A
- lorem lorem lorem ipsu
- lore sir amet dolorew
- Datos fundamentales para el inversor clase G
- Cuentas anuales 2019
- Informe semestral 1S 2020
- lorem ipsum doloer 3
- lorem ipsum doloer
Suitable portfolio for those investors who want exposure to equities, but without forgetting the diversification offered by fixed income.
CUMULATIVE RETURN

PORTFOLIO DETAILS
- Launched on
- Currency
- Time horizon
- Asset classes
- Benchmark index
- Management fee
- Deposit fee
- 31/12/2017
- Euro
- +5 años
- Fondos de Inversión UCIT
- 5% EONIA + 35% RF + 60% RV
- 0,75%
- 0%
PERFORMANCE DATA
- Month
- 2023
- 12 months
- 3 years (annualised)
- 5 years (annualised)
- 2022
- 2021
- 2020
- 2019
- 2018
- 2.95 %
- 5.54 %
- 13.07 %
- 1.97 %
- 4.02 %
- -15,60%
- 9,76%
- 4,96%
- 13,22%
- -8,43%
DOCUMENTATION
- Presentación Narval FI
- Folleto completo
- Folleto clase A
- lorem lorem lorem ipsu
- lore sir amet dolorew
- Datos fundamentales para el inversor clase G
- Cuentas anuales 2019
- Informe semestral 1S 2020
- lorem ipsum doloer 3
- lorem ipsum doloer
Portfolio for investors seeking a majority equity exposure with a high-risk tolerance
CUMULATIVE RETURN

PORTFOLIO DETAILS
- Launched on
- Currency
- Time horizon
- Asset classes
- Benchmark index
- Management fee
- Deposit fee
- 31/12/2017
- Euro
- +5 años
- Fondos de Inversión UCIT
- 5% EONIA + 20% RF + 75% RV
- 0,95%
- 0%
PERFORMANCE DATA
- Month
- 2023
- 12 months
- 3 years (annualised)
- 5 years (annualised)
- 2022
- 2021
- 2020
- 2019
- 2018
- 3.67 %
- 7.12 %
- 16.05 %
- 3.17 %
- 5.93 %
- -16,60%
- 12,72%
- 5,50%
- 21,65%
- -10,51%
DOCUMENTATION
- Presentación Narval FI
- Folleto completo
- Folleto clase A
- lorem lorem lorem ipsu
- lore sir amet dolorew
- Datos fundamentales para el inversor clase G
- Cuentas anuales 2019
- Informe semestral 1S 2020
- lorem ipsum doloer 3
- lorem ipsum doloer
Portfolio for investors seeking a majority equity exposure with a high-risk tolerance.
CUMULATIVE RETURN

PORTFOLIO DETAILS
- Launched on
- Currency
- Time horizon
- Asset classes
- Benchmark index
- Management fee
- Deposit fee
- 31/12/2017
- Euro
- +5 años
- Fondos de Inversión UCIT
- 5% EONIA + 5% RF + 90% RV
- 0,95%
- 0%
PERFORMANCE DATA
- Month
- 2023
- 12 months
- 3 years (annualised)
- 5 years (annualised)
- 2022
- 2021
- 2020
- 2019
- 2018
- 4.1 %
- 8.63 %
- 18.54 %
- 3.4 %
- 6.07 %
- -18,82%
- 14,03%
- 5,50%
- 21,65%
- -10,51%
DOCUMENTATION
- Presentación Narval FI
- Folleto completo
- Folleto clase A
- lorem lorem lorem ipsu
- lore sir amet dolorew
- Datos fundamentales para el inversor clase G
- Cuentas anuales 2019
- Informe semestral 1S 2020
- lorem ipsum doloer 3
- lorem ipsum doloer
How does VERSA work?
Filtering
The fund data are discriminated and prepared to make them comparable and the rest of the processes more accurate and efficient on the main adverse sustainability impacts.
Clustering
Cluster funds into opportunities to encourage diversification and cost reduction.
Ranking
Opportunities are ordered from best to worst according to criteria determined by the management team and with complete independence.
Risk analysis
Allocation of weighting according to long-term and short-term risk.
What is portfolio management?
Portfolio management is a financial investment service for us to design different combinations of financial assets, shares and funds, among others, to create a personalised investment portfolio according to the investor’s preferences and needs.
Our portfolio management service combines the most innovative artificial intelligence technology with the experience of expert asset managers to deliver a track record of high returns.
This combination of technology and human expertise facilitates the achievement of long-term investment goals while also enabling the creation of robust, specialised portfolios similar to those of large investors but without the need to invest large amounts of capital.

We combine the most innovative technology with human capital
Investment simulator

Solid and exclusive portfolios

No obligations or restrictions
Do you have any questions?
We put a team of advisors at your disposal to help you with whatever you need.

OTHER PRODUCTS THAT YOU MIGHT BE INTERESTED IN ↓
Miraltabank
Capital market
Information
We provide trading and execution services to a wide range of institutional clients: investment funds, banks, hedge funds, family offices, agencies and broker-dealers.
Miraltabank
Advice
Information
We offer investment advisory and risk management services to a wide range of institutional customers.


